
Data & Analytics
Forecasts are decisions, not dashboards
Aman Mundra · June 19, 2026 · 11 min read
Contents
- 1. The dashboard failure mode
- 2. What the newsvendor already knew
- 3. When more accuracy makes worse decisions
- 4. Forecast the distribution, not the number
- 5. Evaluate in currency, not percentages
- 6. Wiring a forecast to a decision: an example
- 7. The tradeoffs nobody mentions
- 8. What "good" looks like in practice
- 9. Takeaways
- References
Every forecasting project we have ever been asked to rescue had the same shape. A capable team, a respectable model, a dashboard the executives genuinely liked - and purchasing, staffing, or budget decisions still being made in a spreadsheet, by feel, the way they were before the project started. The forecast was information. Nobody had made it a decision.
This post is about the single highest-leverage change you can make to a forecasting practice, and it is not a better model. It is moving the point of evaluation from the error metric to the decision the forecast feeds. The research backs this up in a way that surprises most teams - on the M5 benchmark, the largest public retail forecasting dataset, the most accurate model is measurably not the most profitable one whenever lost sales cost more than held stock: a more accurate forecast can reliably produce worse business outcomes. Here is why that happens, and how we structure forecasting systems so it doesn't.
Table of contents
1. The dashboard failure mode
2. What the newsvendor already knew
3. When more accuracy makes worse decisions
4. Forecast the distribution, not the number
5. Evaluate in currency, not percentages
6. Wiring a forecast to a decision: an example
7. The tradeoffs nobody mentions
8. What "good" looks like in practice
9. Takeaways
1. The dashboard failure mode
Dashboards fail for a well-documented reason: they are built in isolation from the decisions they are meant to support. Teams build what is easy to measure rather than what someone needs in order to act. Researchers call the result the decision gap: the dashboard presents information but was never designed around a specific decision, so no decision changes.
Forecasts inherit this failure mode with interest, because a forecast looks like a decision aid by construction. A demand chart with a confidence band feels actionable. But watch what the demand planner actually does with it: they read the line, apply a private rule of thumb ("add 15 percent, the model always runs low on promo weeks"), and type a number into the ordering system. The model is a suggestion. The decision logic - the part that determines the money - lives in someone's head, unversioned, unevaluated, and invisible to the team that owns the model.
The test we apply to any forecasting system is the dashboard test sharpened to a point: name the decision, the decision-maker, and the action that changes when the number changes. If any of the three is vague, you are building reporting, not forecasting.
2. What the newsvendor already knew
Operations research solved the conceptual problem seventy years ago with the newsvendor model, and it remains the cleanest lens on why forecast accuracy and decision quality are different things.
A vendor stocks newspapers each morning. Unsold copies are worthless at day's end (overage cost); sold-out stacks mean lost profit (underage cost). The optimal order is not the expected demand. It is the quantile of the demand distribution at the critical ratio:
critical_ratio = underage_cost / (underage_cost + overage_cost)

# A grocery example:
#   margin if sold (underage cost of missing a sale): $4
#   loss if unsold (overage cost of waste):           $1
#   critical ratio = 4 / (4 + 1) = 0.80
#
# Optimal order = the 80th percentile of demand,
# not the mean. If demand ~ N(1000, 200):
#   mean forecast        -> order 1000
#   decision-aware order -> order 1000 + 0.84 * 200 = ~1168
Notice what happened: the correct order quantity is 17 percent above the "perfect" mean forecast. A team optimizing MAPE is optimizing the quality of the number 1000 - a number that, used directly, systematically loses money whenever the costs of being wrong are asymmetric. And they are always asymmetric: understaffing a support desk versus overstaffing it, missing a fraud spike versus adding review friction, stocking out of a hero SKU versus discounting overstock. As a Lehigh paper on learning for the newsvendor problem puts it, the forecast estimates the first moment of a distribution; the decision is the solution to a different optimization problem entirely.
3. When more accuracy makes worse decisions
This is not a theoretical curiosity. A study on the M5 competition data - the largest public retail forecasting benchmark - examined the relationship between forecast accuracy and inventory performance and found that accuracy matters most when holding costs dominate; when the cost of lost sales exceeds the cost of holding, the preferable forecasting method may not be the most accurate one, especially for intermittent demand and short lead times. The authors' conclusion is the thesis of this post: decreasing forecast error is not always enough to improve business performance.
The mechanism is worth internalizing. Accuracy metrics like MAPE and RMSE score the center of your predictive distribution. Decisions driven by asymmetric costs consume the tails. Two models can have identical point accuracy while one describes the tails honestly and the other is confidently narrow - and the confidently narrow one will quietly bleed money at every stockout. A bike-sharing inventory study found the same misalignment: improving accuracy on individual rate forecasts did not improve inventory decisions, because the decision depended on a function of all rates jointly.
In practice we have watched a two-point MAPE improvement ship to production and change nothing downstream, because the planner's private 15 percent haircut absorbed it. And we have watched a switch from point forecasts to quantile forecasts - with zero accuracy improvement - cut expedited-shipping spend by double digits, because the reorder logic finally knew how uncertain the model actually was.
4. Forecast the distribution, not the number
If decisions consume tails, the forecast artifact must expose them. Concretely, that means the deliverable is quantiles (or a full predictive distribution), not a single number per period:
# The artifact that feeds a decision is not:
#   forecast(sku, week) -> 1000
# It is:
#   forecast(sku, week) -> {p10: 720, p50: 990, p80: 1170, p95: 1420}
#
# Training changes one line: swap the loss.
# Pinball (quantile) loss for quantile q:
def pinball_loss(y_true, y_pred, q):
    diff = y_true - y_pred
    return max(q * diff, (q - 1) * diff)
# LightGBM: objective="quantile", alpha=0.8
# Most modern libraries (statsforecast, GluonTS, Prophet-likes)
# emit quantiles natively - this is a config choice, not a rebuild.
Then each decision reads the quantile its economics dictate: the grocery order reads p80 because its critical ratio is 0.8; the staffing plan reads p90 because a missed SLA costs ten times an idle hour; the finance plan reads p50 because it wants an unbiased central view. One model, one training run, several decisions - each consuming the slice of uncertainty that matches its own cost structure. This is the practical meaning of "forecasts are decisions": the quantile choice is the decision policy, written down at last, versioned next to the model instead of living in a planner's head.
5. Evaluate in currency, not percentages
The second structural change: score the system where it spends money. Alongside the standard accuracy suite, we compute a decision loss - replay history, apply the decision policy to each model's forecasts, and price the outcomes with the same overage/underage costs the business signed off on.
# Decision-loss backtest, the whole idea:
for week in backtest_weeks:
    order   = quantile_forecast(week, q=critical_ratio)
    demand  = actuals[week]
    cost   += overage_cost  * max(order - demand, 0) \
            + underage_cost * max(demand - order, 0)
# Report: "$ left on the table per week vs oracle",
# next to MAPE - and watch which one changes the meeting.
Reporting this number does two things. First, model selection changes: the multi-objective forecast combination literature shows that optimizing accuracy and decision outcomes jointly beats accuracy-only selection - sometimes the "third best" model by MAPE is the best by dollars. Second, the conversation with the business changes. "MAPE improved 2 points" earns a nod. "This change is worth $40k a month against the same decisions you make today" earns a roadmap. As Amazon's own guidance puts it, the goal was never a perfect forecast - it is making better decisions than you would without one.
6. Wiring a forecast to a decision: an example
What this looks like assembled, from a retail replenishment engagement pattern we reuse:
- Decision registry first. Before modeling, a one-page table: decision, owner, cadence, action space, overage cost, underage cost, current rule. Ten rows of this are worth more than any accuracy improvement, and writing it usually surfaces that half the "forecasting asks" are actually reporting asks. Cut those.
- Quantile forecasts as the contract. The model service emits p10/p50/p80/p95 per SKU-week. The contract is documented and versioned; downstream consumers choose quantiles, never re-derive them.
- Decision policy as code. The reorder rule (critical ratio, minimums, pack-size rounding, supplier constraints) is a reviewed, tested function in the repo - not spreadsheet logic. The planner's old 15 percent haircut either becomes an explicit bias correction with a ticket explaining why, or it dies in review.
- Override loop with memory. Planners can override, and overrides are logged with a reason code. Quarterly, we score overrides against the policy. Both outcomes are wins: either the humans are finding signal the model misses (new feature, free), or they aren't (trust grows, overrides shrink).
- Decision-loss on the scorecard. The weekly report leads with dollars against oracle and against the pre-project baseline. MAPE is in the appendix, where it belongs.
7. The tradeoffs nobody mentions
Decision-centric forecasting is the right default, and it is not free. What it costs, honestly:
- You need the costs, and the costs are political. Overage and underage costs are estimates that finance, operations, and merchandising may not agree on. Expect the first workshop to produce ranges, not numbers. Ship with the range; sensitivity-test the policy against it. A decision policy that is stable across the plausible cost range is the real deliverable.
- Quantile forecasts are harder to explain. "We order the 80th percentile" needs a translation layer for stakeholders raised on single numbers. The newsvendor example in section 2, drawn on one slide with their own margins, does the job - but budget the communication effort.
- Decision loss can be gamed too. Any single metric optimized hard enough becomes a target. Keep the standard accuracy suite as a sanity harness so a degenerate policy (order the max every week) cannot hide behind a favorable cost ratio.
- Some decisions resist the framing. Long-horizon strategic forecasts (capacity, market entry) feed judgment, not automatable policies. There, the honest artifact is scenarios with assumptions attached - forcing them into the newsvendor mold is cosplay. Say so and move on.
8. What "good" looks like in practice
Signals that a forecasting practice has crossed from dashboards to decisions - the checklist we run in maturity assessments:
- Every production forecast names its consuming decision and owner in the model card. Orphan forecasts get deprecated on a schedule.
- The evaluation report prices errors in currency, and model promotions cite that number.
- Predictive distributions are the interface; any point forecast in a pipeline is a documented, deliberate collapse of one.
- Decision policies live in version control with tests, and overrides are logged and periodically scored.
- Directional honesty beats decimal theater: per practitioner guidance, a consistently applied forecast connected to its decision beats a sophisticated model that isn't - and typical short-term MAPE targets of 10 to 20 percent are a floor for usefulness, not a trophy.
9. Takeaways
- A forecast's value is realized at a decision. Name the decision, the owner, and the action before you model.
- Accuracy and decision quality diverge whenever error costs are asymmetric - which is always. The M5 evidence says the most accurate model can be the wrong choice.
- Deliver quantiles; let each decision consume the quantile its critical ratio dictates. The quantile choice is the decision policy, finally written down.
- Add decision loss - dollars against oracle - to every evaluation. Promote models on it.
- Put the decision rule in code review, log the overrides, and score them. The planner's haircut is either a feature or a bug; find out which.
- Where a decision genuinely can't be formalized, ship scenarios with assumptions, and don't pretend otherwise.
References
- Forecast accuracy and inventory performance: insights from the M5 competition data (European Journal of Operational Research)
- Applying deep learning to the newsvendor problem (Lehigh University)
- Multi-objective probabilistic forecast combination for inventory demand (arXiv)
- Predictive and prescriptive performance of bike-sharing demand forecasts for inventory management (arXiv)
- Why dashboards fail and how to fix it (The Virtual Forge)
- How demand forecasting drives smarter inventory decisions (Amazon Business)
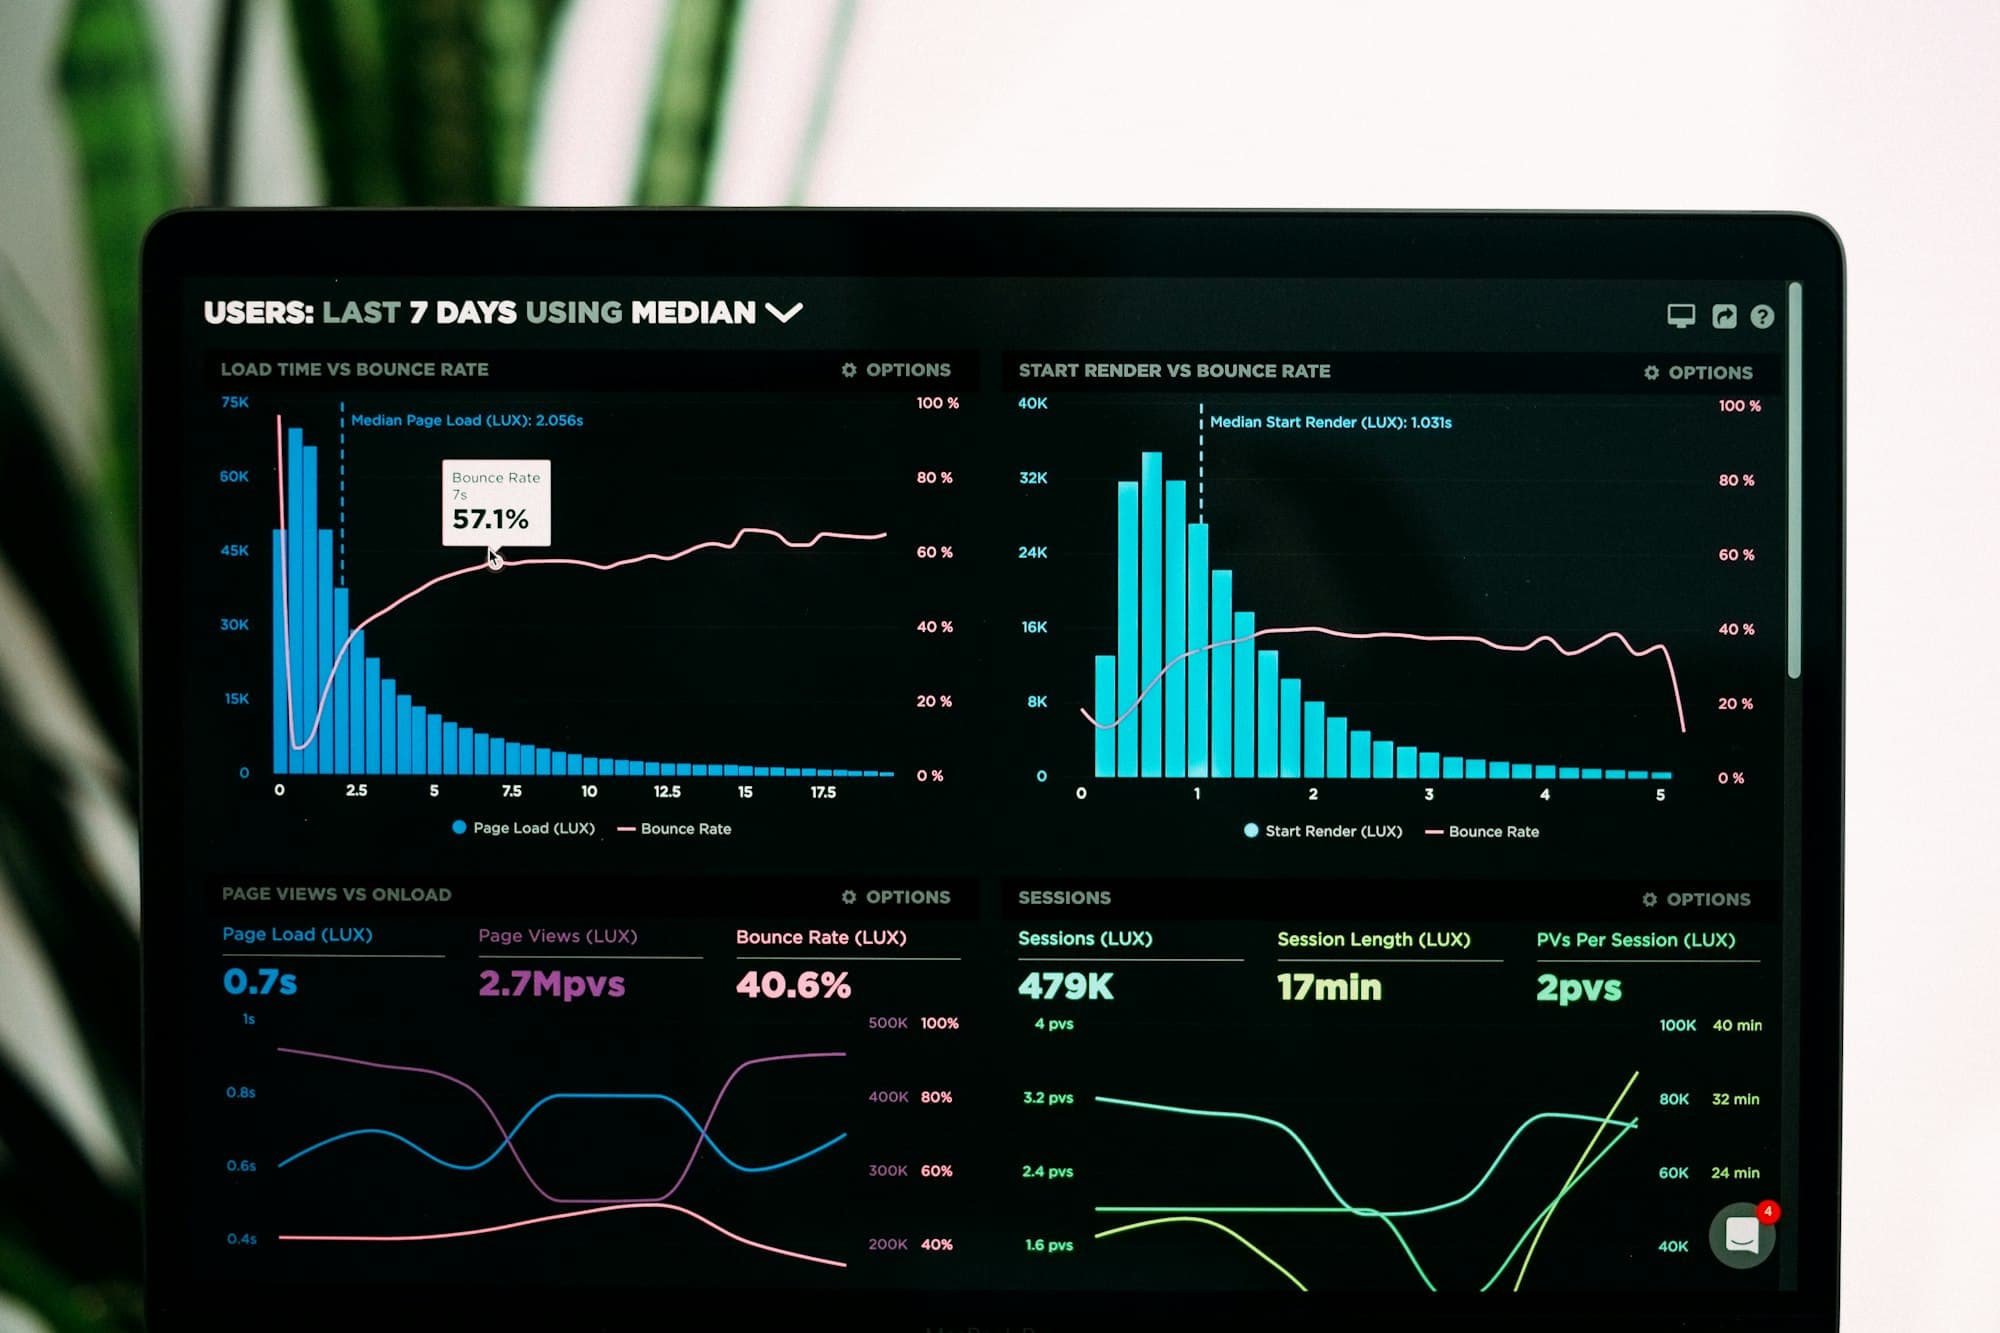
Hero image: Luke Chesser on Unsplash.
We build forecasting systems that end at decisions, not dashboards. Explore our other insights or get in touch if you would like to talk it through.
Frequently asked questions
Why can the most accurate forecast still produce worse business decisions?
Because accuracy metrics like MAPE and RMSE score the center of the predictive distribution, while decisions driven by asymmetric costs consume the tails. Two models can have identical point accuracy while one describes the tails honestly and the other is confidently narrow, and the narrow one quietly bleeds money at every stockout. Analysis of the M5 retail benchmark found that when the cost of lost sales exceeds the cost of holding stock, the preferable forecasting method may not be the most accurate one, especially for intermittent demand and short lead times. Decreasing forecast error is not always enough to improve business performance.
What is the newsvendor model and why does it matter for forecasting?
The newsvendor model is a seventy-year-old operations research result showing the optimal stocking quantity is not the expected demand but a specific quantile of the demand distribution. That quantile is set by the critical ratio, underage cost divided by the sum of underage and overage costs. For a grocery item with a $4 margin on a sale and a $1 loss on waste, the critical ratio is 0.80, so the optimal order is the 80th percentile of demand, not the mean. It matters because it cleanly separates forecast accuracy from decision quality: the forecast estimates a distribution, but the decision is a different optimization problem entirely.
Why should a forecast deliver a distribution of quantiles instead of a single number?
Because decisions consume the tails of uncertainty, so the forecast has to expose them. Delivering quantiles like p10, p50, p80, and p95 lets each decision read the slice its economics dictate: a grocery order reads p80 when its critical ratio is 0.8, a staffing plan reads p90 when a missed SLA costs ten times an idle hour, and a finance plan reads p50 for an unbiased central view. One model and one training run then serve several decisions, each consuming the uncertainty that matches its own cost structure. Technically this is usually a config choice, swapping in pinball (quantile) loss, not a rebuild, since most modern libraries emit quantiles natively.
How do you evaluate a forecast by the decision instead of the error metric?
You compute a decision loss alongside the standard accuracy suite: replay history, apply the decision policy to each model's forecasts, and price the outcomes with the same overage and underage costs the business signed off on. The report then leads with dollars left on the table per week versus an oracle, not just MAPE. This changes both model selection, since sometimes the third-best model by MAPE is the best by dollars, and the business conversation, since worth $40k a month against the same decisions you make today earns a roadmap where a two-point accuracy gain earns only a nod. Keep the accuracy suite as a sanity check so a degenerate policy cannot hide behind a favorable cost ratio.